
Home sales and listings trends are below long-term averages in the Metro Vancouver* housing market. This is due largely to reduced activity in the detached home market.
Residential property sales in the region totalled 1,523 in January 2017, a 39.5 per cent decrease from the 2,519 sales recorded in January 2016 and an 11.1 per cent decrease compared to December 2016 when 1,714 homes sold.
Last month’s sales were 10.3 per cent below our 10-year January sales average.
“From a real estate perspective, it’s a lukewarm start to the year compared to 2016,” Dan Morrison, Real Estate Board of Greater Vancouver (REBGV) president said. “While we saw near record-breaking sales at this time last year, home buyers and sellers are more reluctant to engage so far in 2017.”
New listings for detached, attached and apartment properties in Metro Vancouver totalled 4,140 in January 2017. This represents a 6.8 per cent decrease compared to the 4,442 homes listed in January 2016 and a 215.5 per cent increase compared to December 2016 when 1,312 properties were listed.
The total number of homes currently listed for sale on the Multiple Listing Service® (MLS®) in Metro Vancouver is 7,238, a 9.1 per cent increase compared to January 2016 (6,635) and a 14.1 per cent increase compared to December 2016 (6,345).
The sales-to-active listings ratio for January 2017 is 21 per cent. This is the lowest the ratio has been in the region since January 2015. Generally, analysts say that downward pressure on home prices occurs when the ratio dips below the 12 per cent mark for a sustained period, while home prices often experience upward pressure when it surpasses 20 per cent over several months.
“Conditions within the market vary depending on property type. The townhome and condominium markets are more active than the detached market at the moment,” Morrison said. “As a result, detached home prices declined about 7 per cent since peaking in July while townhome and condominium prices held steady over this period.”
The MLS® Home Price Index composite benchmark price for all residential properties in Metro Vancouver is currently $896,000. This represents a 3.7 per cent decline over the past six months and a 0.2 per cent decrease compared to December 2016.
Sales of detached properties in January 2017 reached 444, a decrease of 57.6 per cent from the 1,047 detached sales recorded in January 2016. The benchmark price for detached properties is $1,474,800. This represents a 6.6 per cent decline over the last six months and a 0.6 per cent decrease compared to December 2016.
Sales of apartment properties reached 825 in January 2017, a decrease of 24.7 per cent compared to the 1,096 sales in January 2016.The benchmark price of an apartment property is $512,300. This represents a 0.3 per cent increase over the last six months and a 0.4 per cent increase compared to December 2016.
Attached property sales in January 2017 totalled 254, a decrease of 32.4 per cent compared to the 376 sales in January 2016. The benchmark price of an attached unit is $666,500. This represents a 0.4 per cent decline over the last six months and a 0.7 per cent increase compared to December 2016.
A heated year for Metro Vancouver real estate draws to a close
Posted on
January 4, 2017
by
Shirley Louie
The Metro Vancouver housing market had its third highest selling year on record in 2016, behind only 2015 and 2005.
Sales of detached, attached and apartment properties in the region reached 39,943 in 2016, a 5.6 per cent decrease from the 42,326 sales recorded in 2015, and a 20.6 per cent increase over the 33,116 residential sales in 2014.
“It was an eventful year for real estate in Metro Vancouver. Escalating prices caused by low supply and strong home buyer demand brought more attention to the market than ever before,” Dan Morrison, Real Estate Board of Greater Vancouver (REBGV) president said.
“As prices rose in the first half of the year, public debate waged about what was fuelling demand and what should be done to stop it. This led to multiple government interventions into the market. The long-term effects of these actions won’t be fully understood for some time.”
Residential properties listed for sale on the Multiple Listing Service® (MLS®) in Metro Vancouver reached 57,596 in 2016. This is an increase of 0.6 per cent compared to the 57,249 properties listed in 2015 and a 2.6 per cent increase compared to the 56,066 properties listed in 2014.
“The supply of homes for sale couldn't keep up with home buyer demand for much of 2016. This allowed home sellers to raise their asking price. It wasn’t until the last half of the year that prices began to show modest declines.”
The MLS® Home Price Index (HPI) composite benchmark price for all residential properties in Metro Vancouver ends the year at $897,600. This represents a 2.2 per cent decrease over the past six months and a 17.8 per cent increase compared to December 2015.
December summary
Residential property sales in the region totalled 1,714 in December 2016, a decrease of 39.4 per cent from the 2,827 sales recorded in December 2015 and a decrease of 22.6 per cent compared to November 2016 when 2,214 homes sold.
Last month’s sales were 8.1 per cent below the 10-year sales average for the month.
New listings for detached, attached and apartment properties in Metro Vancouver totalled 1,312 in December 2016. This represents a decrease of 35.1 per cent compared to the 2,021 units listed in December 2015 and a 58.3 per cent decrease compared to November 2016 when 3,147 properties were listed.
The total number of properties currently listed for sale on the MLS® in Metro Vancouver is 6,345, a 5.3 per cent increase compared to December 2015 (6,024) and a 24.3 per cent decrease compared to November 2016 (8,385).
Sales of detached properties in December 2016 reached 541, a decrease of 52.4 per cent from the 1,136 detached sales recorded in December 2015. The benchmark price for detached properties is $1,483,500. This represents an 18.6 per cent increase compared to December 2015 and a 1.8 per cent decrease compared to November 2016.
Sales of apartment properties reached 915 in December 2016, a decrease of 25.3 per cent compared to the 1,225 sales in December 2015.The benchmark price of an apartment property is $510,300. This represents a 17.3 per cent increase compared to December 2015 and a 0.3 per cent decrease compared to November 2016.
Attached property sales in December 2016 totalled 258, a decrease of 44.6 per cent compared to the 466 sales in December 2015. The benchmark price of an attached unit is $661,800. This represents a 20.4 per cent increase compared to December 2015 and a 0.8 per cent decrease compared to November 2016.
BC government to offer down payment loans for first-time buyers
Posted on
December 15, 2016
by
Shirley Louie
Premier Christy Clark unveiled a new loan program today to help first-time home buyers come up with their down payment.
The BC Home Owner Mortgage and Equity (HOME) Partnership program will offer qualifying home buyers loans of up to $37,500, interest and payment free, for five years.
The province will begin accepting applications on January 16, 2017.
To qualify, buyers must:
• be buying their first home;
• obtain a high-ratio, insured first mortgage for at least 80 per cent of the purchase price;
• have a combined gross household income not exceeding $150,000;
• have saved a down payment amount at least equal to the loan amount;
• be a Canadian citizen or permanent resident for at least five years; and
• have lived in BC for at least the full year preceding their application.
The loans will be due in full if the buyer defaults on a payment, ceases to use the home as a principle residence or resells the home.
Key facts:
• The loans will match a home buyer’s contribution to a down payment up to five per cent of the home’s purchase price.
• The maximum purchase price to qualify for a loan is $750,000 (excluding taxes and fees).
• After five years, buyers can either repay their loan or enter into monthly payments at current interest rates.
• Loans through the program are due after 25 years.
“This program will boost sales to first-time home buyers. Without question, they’ll take advantage of it wherever they can,” said Helmut Pastrick, Central 1 Credit Union chief economist.
The province estimates this initiative will help at least 42,000 buyers or households province-wide over the next three years. About half of these buyers will be in the Lower Mainland, according to Pastrick.
Home sales and listings just below 10-year average
Posted on
December 2, 2016
by
Shirley Louie
Home buyer and seller activity remains near historical averages in the Metro Vancouver housing market.
Residential home sales in the region totalled 2,214 in November 2016, a decrease of 0.9 per cent from the 2,233 sales recorded in October 2016 and a decrease of 37.2 per cent compared to November 2015 when 3,524 homes sold.
Last month’s sales were 7.6 per cent below the 10-year sales average for the month.
“While 2016 has been anything but a normal year for the Metro Vancouver housing market, supply and demand totals have returned to more historically normal levels over the last few months,” said Dan Morrison, Real Estate Board of Greater Vancouver (REBGV) president.
New listings for detached, attached and apartment properties in Metro Vancouver totalled 3,147 in November 2016. This represents a decrease of 20.9 per cent compared to the 3,981 units listed in October 2016 and a 7.2 per cent decrease compared to November 2015 when 3,392 properties were listed.
Last month’s new listing count was 1.2 per cent below the region’s 10-year new listing average for the month.
The total number of properties currently listed for sale on the MLS® system in Metro Vancouver is 8,385, an 8.3 per cent decrease compared to October 2016 (9,143) and a 3.6 per cent increase compared to November 2015 (8,096).
The sales-to-active listings ratio for November 2016 is 26.4 per cent. This is up two per cent from last month (24.4 per cent).
Downward pressure on home prices can occur when the ratio dips below the 12 per cent mark for a sustained period, while home prices can experience upward pressure when it surpasses 20 per cent over several months.
“Demand, relative to supply, for detached homes is lower right now than demand for townhomes and apartments,” Morrison said. “This is causing prices to remain stable, or flat, for townhomes and apartments, while detached homes are seeing modest month-over-moth declines.”
The MLS® Home Price Index composite benchmark price for all residential properties in Metro Vancouver is currently $908,300. This represents a 1.2 per cent decrease compared to last month and a 20.5 per cent increase compared to November 2015.
Sales of detached properties in November 2016 reached 638, a decrease of 2.1 per cent from the 652 detached sales recorded in October 2016 and a 52.2 per cent decline over November 2015. The benchmark price for detached properties is $1,511,100. This represents a 2.2 per cent decline compared to last month and a 23 per cent increase compared to November 2015.
Sales of apartment properties reached 1,200 in November 2016, an increase of 1.9 per cent compared to the 1,178 sales in October 2016 and a 22.7 per cent decrease compared to November 2015.The benchmark price of an apartment property is $512,100. This is unchanged from last month and is an 18 per cent increase compared to November 2015.
Attached property sales in November 2016 totalled 376, a decrease of 6.7 per cent compared to the 403 sales in October 2016 and a 40.9 per cent decline compared to November 2015. The benchmark price of an attached unit is $667,100. This represents a 0.3 per cent decrease compared to last month and a 23 per cent increase compared to November 2015.
Home sale and listing activity dip below historical averages in October
Posted on
November 3, 2016
by
Shirley Louie
Reduced home sale and listing activity are changing market dynamics in communities across Metro Vancouver*.
Residential property sales in the region totalled 2,233 in October 2016, a 38.8 per cent decrease from the 3,646 sales recorded in October 2015 and a 0.9 per cent decrease compared to September 2016 when 2,253 homes sold.
Last month’s sales were 15 per cent below the 10-year October sales average.
“Changing market conditions compounded by a series of government interventions this year have put home buyers and sellers in a holding pattern,” Dan Morrison, Real Estate Board of Greater Vancouver (REBGV) president said. “Potential buyers and sellers are taking a wait-and-see approach to try and better understand what these changes mean for them.”
New listings for detached, attached and apartment properties in Metro Vancouver totalled 3,981 in October 2016. This represents a decrease of 3.5 per cent compared to the 4,126 units listed in October 2015 and a 17 per cent decrease compared to September 2016 when 4,799 properties were listed.
Last month’s new listing count was 9.5 per cent below the region’s 10-year new listing average for the month.
The total number of properties currently listed for sale on the MLS® system in Metro Vancouver is 9,143, a 4.5 per cent decrease compared to October 2015 (9,569) and a 2.3 per cent decrease compared to September 2016 (9,354).
The sales-to-active listings ratio for October 2016 is 24.4 per cent. Generally, analysts say that downward pressure on home prices occurs when the ratio dips below the 12 per cent mark for a sustained period, while home prices often experience upward pressure when it surpasses 20 per cent over several months.
“While sales are down across the different property types, it’s the detached market that’s seen the largest reduction in home buyer demand in recent months,” Morrison said. “It’s important to work with your local REALTOR® to help you navigate today’s changing trends.”
The MLS® Home Price Index composite benchmark price for all residential properties in Metro Vancouver is currently $919,300. This represents a 24.8 per cent increase compared to October 2015 and a 0.8 per cent decline compared to September 2016.
Sales of detached properties in October 2016 reached 652, a decrease of 54.6 per cent from the 1,437 detached sales recorded in October 2015. The benchmark price for detached properties is $1,545,800. This represents a 28.9 per cent increase compared to October 2015 and a 1.4 per cent decrease compared to September 2016.
Sales of apartment properties reached 1,178 in October 2016, a decrease of 23.7 per cent compared to the 1,543 sales in October 2015.The benchmark price of an apartment property is $512,300. This represents a 20.5 per cent increase compared to October 2015 and a 0.3 per cent increase compared to September 2016.
Attached property sales in October 2016 totalled 403, a decrease of 39.5 per cent compared to the 666 sales in October 2015. The benchmark price of an attached unit is $669,200. This represents a 25.7 per cent increase compared to October 2015 and a 1.1 per cent decrease compared to September 2016.
Home buyers and sellers face changing market dynamics
Posted on
October 4, 2016
by
Shirley Louie
Metro Vancouver* home sales dipped below the 10-year monthly sales average last month. This is the first time this has occurred in the region since May 2014.
Metro Vancouver home sales totalled 2,253 in September 2016, a decrease of 32.6 per cent from the 3,345 sales recorded in September 2015 and a decrease of 9.5 per cent compared to August 2016 when 2,489 homes sold.
Last month’s sales were 9.6 per cent below the 10-year sales average for the month.
“Supply and demand conditions differ today depending on property type,” Dan Morrison, REBGV president said. “We’re seeing more demand for condominiums and townhomes today than in the detached home market.”
New listings for detached, attached and apartment properties in Metro Vancouver totalled 4,799 in September 2016. This represents a decrease of one per cent compared to the 4,846 units listed in September 2015 and an 11.8 per cent increase compared to August 2016 when 4,293 properties were listed.
The total number of homes currently listed for sale on the MLS® system in Metro Vancouver is 9,354, a 13.4 per cent decline compared to September 2015 (10,805) and a 10 per cent increase compared to August 2016 (8,506).
The sales-to-active listings ratio for September 2016 is 24.1 per cent. This is the lowest this ratio has been since February 2015. Generally, analysts say that downward pressure on home prices occurs when the ratio dips below the 12 per cent mark, while home prices often experience upward pressure when it reaches the 20 to 22 per cent range in a particular community for a sustained period.
“Changing market conditions are easing upward pressure on home prices in our region,” Morrison said. “There’s uncertainty in the market at the moment and home buyers and sellers are having difficulty establishing price as a result. To help you understand the factors affecting prices, it’s important to talk with a REALTOR®.”
The MLS® Home Price Index composite benchmark price for all residential properties in Metro Vancouver is currently $931,900. This represents a 28.9 per cent increase compared to September 2015 and a 0.1 per cent decline compared to August 2016.
Sales of detached properties in September 2016 reached 666, a decrease of 47.6 per cent from the 1,272 detached sales recorded in September 2015. The benchmark price for detached properties is $1,579,400. This represents a 33.7 per cent increase compared to September 2015 and a 0.1 per cent increase compared to August 2016.
Sales of apartment properties reached 1,218 in September 2016, a decrease of 20.3 per cent compared to the 1,529 sales in September 2015.The benchmark price of an apartment property is $511,800. This represents a 23.5 per cent increase compared to September 2015 and a 0.5 per cent decline compared to August 2016.
Attached property sales in September 2016 totalled 369, a decrease of 32.2 per cent compared to the 544 sales in September 2015. The benchmark price of an attached unit is $677,000. This represents a 29.1 per cent increase compared to September 2015 and a 0.1 per cent decline compared to August 2016.
Federal government changes mortgage insurance rules
Posted on
October 2, 2016
by
Shirley Louie
The federal government announced regulation changes for new government-backed insured mortgages today. Effective October 17, 2016, insured homebuyers will have to qualify at the posted five-year qualifying rate. Previously, only variable rate mortgages and mortgages with terms less than five years were subject to a higher qualifying rate.
The qualifying rate is updated weekly and available on the Bank of Canada website. The current rate is 4.64 per cent, about 200 basis points higher than the best bank offered rates.
To qualify for mortgage insurance, a homebuyer's debt servicing ratio must be no higher than:
• Gross Debt Service – 39 per cent of household income, including mortgage payment, taxes, and heating costs.
• Total Debt Service – 44 per cent of household income, including mortgage payment, taxes, heating costs, and all other debt payments
These changes will apply to new mortgage insurance applications received on October 17, 2016 or later. Mortgage insurance applications received after October 2, 2016 and before October 17, 2016 are also not affected by the rule change, provided that the mortgage is funded by March 1, 2017. Homeowners with an existing insured mortgage or those renewing existing insured mortgages aren’t affected by this measure.
These changes also won’t apply to mortgage loans where:
• the lender made a legally binding commitment to make the loan;
• the borrower entered into a legally binding agreement for the property against which the loan is secured.
The federal government is also instituting new eligibility rules for low-ratio (higher than 20 per cent down payment) mortgages backed by government insurance. As of November 30, 2016, to be eligible for government insurance, new mortgages must meet the following requirements:
1. A loan whose purpose includes the purchase of a property or subsequent renewal of such a loan;
2. A maximum amortization length of 25 years;
3. A maximum purchase price below $1,000,000 when the loan is approved;
4. For variable-rate loans that allow fluctuations in the amortization period, loan payments that are recalculated at least once every five years to conform to the original amortization schedule;
5. A minimum credit score of 600 at the time the loan is approved;
6. A maximum Gross Debt Service ratio of 39 per cent and a maximum Total Debt Service ratio of 44 per cent at the time the loan is approved, calculated by applying the greater of the mortgage contract rate or the Bank of Canada conventional five-year fixed posted rate; and,
7. A property that will be owner-occupied.
These new criteria, in particular requiring a maximum purchase price below $1 million, will essentially make the majority of single family homes in Metro Vancouver ineligible for government issued insurance for low-ratio mortgages.
The government also announced measures to ensure that the exemption from capital gains tax on the sale of a principal residence is available only in appropriate cases.
(Thanks to the BC Real Estate Association’s Economics department for this analysis.)
Metro Vancouver home sales return to typical August levels
Posted on
September 5, 2016
by
Shirley Louie
For the second straight month, home buyer demand in Metro Vancouver* moved off of the record-breaking pace seen earlier this year and returned to more typical levels.
The Real Estate Board of Greater Vancouver (REBGV) reports that residential property sales in Metro Vancouver totalled 2,489 in August 2016, a decline of 26 per cent compared to the 3,362 sales in August 2015; 10.2 per cent less than the 2,771 sales in August 2014; and one per cent less than the 2,514 sales in August 2013. August 2016 sales also represent a 22.8 per cent decline compared to last month’s sales.
From a historical perspective, last month’s sales were 3.5 per cent below the 10-year sales average for the month.
“The record-breaking sales we saw earlier this year were replaced by more historically normal activity throughout July and August,” Dan Morrison, REBGV president said. "Sales have been trending downward in Metro Vancouver for a few months. The new foreign buyer tax appears to have added to this trend by reducing foreign buyer activity and causing some uncertainty amongst local home buyers and sellers.
“It’ll take some months before we can really understand the impact of the new tax. We'll be interested to see the government's next round of foreign buyer data."
New listings for detached, attached and apartment properties in Metro Vancouver totalled 4,293 in August 2016. This represents an increase of 0.3 per cent compared to the 4,281 units listed in August 2015 and an 18.1 per cent decrease compared to July 2016 when 5,241 properties were listed.
The total number of properties currently listed for sale on the MLS® in Metro Vancouver is 8,506, a 21.9 per cent decline compared to August 2015 (10,897) and a 1.9 per cent increase from July 2016 (8,351).
The sales-to-active listings ratio for August 2016 is 29.3 per cent. This is indicative of a seller’s market.
Generally, analysts say that downward pressure on home prices occurs when the ratio dips below the 12 per cent mark, while home prices often experience upward pressure when it reaches the 20 to 22 per cent range in a particular community for a sustained period.
The MLS® Home Price Index composite benchmark price for all residential properties in Metro Vancouver is currently $933,100. This represents a 31.4 per cent increase compared to August 2015 and a 4.9 per cent increase over the last three months.
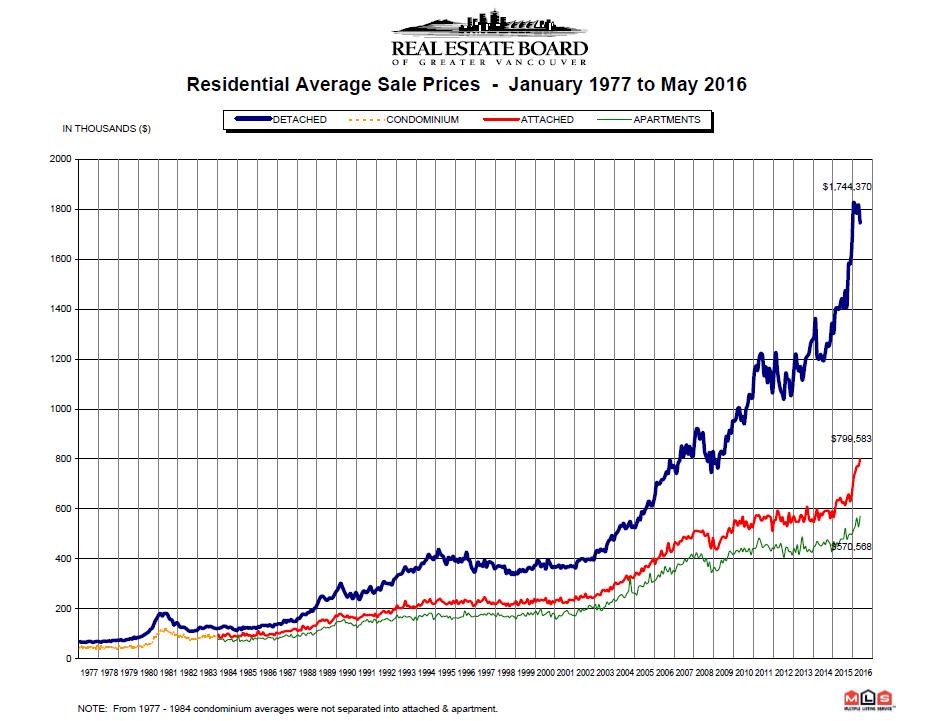
“In aggregate, we continue to see an imbalance between supply and demand in most communities. However, we’re also seeing fewer detached sales in the highest price points and fewer detached home sales relative to all residential sales,” Morrison said. “This is causing average sale prices to show a decline in recent months, while benchmark home prices remain virtually unchanged from July.”
The average price is the simplest home price measure to explain but is not the most accurate since it may be skewed by the mix of properties. More high-end or low-end sales will skew the number up or down. Based on the Consumer Price Index, MLS HPI® benchmark prices are a more reliable and stable indicator of typical home prices across regions over time.
Sales of detached properties in August 2016 reached 715, a decrease of 44.6 per cent from the 1,290 detached sales recorded in August 2015. The benchmark price for detached properties increased 35.8 per cent from August 2015 to $1,577,300. This represents a 4.2 per cent increase over the last three months.
Sales of apartment properties reached 1,343 in August 2016, a decrease of 10.1 per cent compared to the 1,494 sales in August 2015.The benchmark price of an apartment property increased 26.9 per cent from August 2015 to $514,300. This represents a 6.1 per cent increase over the last three months.
Attached property sales in August 2016 totalled 431, a decrease of 25.4 per cent compared to the 578 sales in August 2015. The benchmark price of an attached home increased 31.1 per cent from August 2015 to $677,600. This represents a 7.1 per cent increase over the last three months.
Home sales move off of record breaking pace in July
Posted on
August 3, 2016
by
Shirley Louie
Metro Vancouver* homes sales resembled more typical levels in July.
The Real Estate Board of Greater Vancouver (REBGV) reports that residential property sales in the region totalled 3,226 in July 2016, a decrease of 18.9 per cent from the 3,978 sales recorded in July 2015 and a decrease of 26.7 per cent compared to June 2016 when 4,400 homes sold.
This is the first time since January that home sales in the region have registered below 4,000 in a month.
“After several months of record-breaking sales activity, home buyer demand returned to more historically normal levels in July,” Dan Morrison, REBGV president said.
Last month’s sales were 6.5 per cent above the 10-year sales average for the month.
“Home sale activity showed some moderating signs in late June and this carried into July,” Morrison said. “We’ll wait and watch over the next few months to see if this marks the return of more normal market trends.”
New listings for detached, attached and apartment properties in Metro Vancouver totalled 5,241 in July 2016. This represents a 2.5 per cent increase compared to the 5,112 units listed in July 2015 and a 10.8 per cent decrease compared to June 2016 when 5,875 properties were listed.
The total number of properties currently listed for sale on the MLS® system in Metro Vancouver is 8,351, a 27.4 per cent decline compared to July 2015 (11,505) and a 6.9 per cent increase compared to June 2016 (7,812).
The sales-to-active listings ratio for July 2016 is 38.6 per cent. Generally, analysts say that downward pressure on home prices occurs when the ratio dips below the 12 per cent mark, while home prices experience upward pressure when it reaches the 20 to 22 per cent range in a particular community for a sustained period of time.
The MLS® Home Price Index composite benchmark price for all residential properties in Metro Vancouver is currently $930,400. This represents a 32.6 per cent increase compared to July 2015.
Sales of detached properties in July 2016 reached 1,077, a decrease of 30.9 per cent from the 1,559 detached sales recorded in July 2015. The benchmark price for detached properties increased 38 per cent from July 2015 to $1,578,300.
Sales of apartment properties reached 1,602 in July 2016, a decrease of 7.3 per cent compared to the 1,729 sales in July 2015.The benchmark price of an apartment property increased 27.4 per cent from July 2015 to $510,600.
Attached property sales in July 2016 totalled 547, a decrease of 20.7 per cent compared to the 690 sales in July 2015. The benchmark price of an attached unit increased 29.4 per cent from July 2015 to $669,000.
*Editor’s Note: Areas covered by Real Estate Board of Greater Vancouver include: Whistler, Sunshine Coast, Squamish, West Vancouver, North Vancouver, Vancouver, Burnaby, New Westminster, Richmond, Port Moody, Port Coquitlam, Coquitlam, Pitt Meadows, Maple Ridge, and South Delta.
Government to introduce a 15 per cent foreign buyer tax effective August 2, 2016
Posted on
July 25, 2016
by
Shirley Louie
The provincial government will implement a 15 per cent foreign buyer tax on all residential transactions effective August 2, 2016. The tax will be added to the Property Transfer Tax and will apply to all residential properties purchased by foreign nationals or foreign-controlled corporations.
The new tax will be payable on applicable transfers registered with the Land Title Office on or after August 2 regardless of when the deal was completed.
The tax will apply to any transferee that is a foreign national, foreign corporation, or taxable trustee. Foreign nationals are defined as people who aren’t Canadian citizens or have permanent resident status in Canada.
“Housing affordability concerns all of us who live in the region. Implementing a new real estate tax, however, with just eight days’ notice and no consultation with the professionals who serve home buyers and sellers every day needlessly injects uncertainty into the market,” Dan Morrison, Board president said. “Government has had a long time to take action on the affordability issue, yet they decide to bring this new tax in over a long weekend, with no notice, and no time to prepare. It would have been prudent to seek consultation from the people most knowledgeable about the impact.”
Under the new tax, for example, a foreign buyer or foreign-controlled entity will pay an additional $300,000 in tax on a $2 million home.
“To minimize short-term volatility in the market, we’re calling on government to exempt real estate transactions that are in the process of closing from this new tax,” Morrison said.
Foreign corporations are any corporation not incorporated in Canada, or are incorporated in Canada but controlled in part, or wholly, by a foreign national or corporation. Publicly traded companies are excluded.
Commercial properties are excluded, and mixed-use properties will only pay the tax on the portion of the property’s value that’s for residential use.
Data Shows Foreign Buyers Make Up Five Per Cent of Metro Vancouver Market
Posted on
July 8, 2016
by
Shirley Louie
Foreign nationals make up 5.1 per cent of home buyers in Metro Vancouver, according to the first set of real estate transaction data released by the provincial government today.
This confirms data you’ve provided us for several years through our monthly member market poll.
“We wrote the Minister of Finance earlier this year asking him to again track the residency of home buyers in BC and we applaud the government for taking action on this issue,” Dan Morrison, Board president said. “The housing affordability challenge we face is of critical importance to all of us in the region and it’s important that this debate be based on facts. We look forward to the province releasing larger data sets in the future to further inform this conversation.”
The government will continue to release this data each month. The current set covers transactions between June 10 and June 29, 2016.
The data is collected when owners register their property at the Land Title Office and the Property Transfer Tax is paid. Individuals must disclose if they’re a Canadian citizen or permanent resident, or if their citizenship if not Canadian. Corporations must disclose their directors’ citizenship.
Additional findings include:
• 10,148 residential real estate transactions in BC, totalling more than $7.6 billion.
• 337 transactions (3.3 per cent) involved foreign nationals, worth $390 million (5.1 per cent).
• In Metro Vancouver, there were 5,118 transactions worth nearly $5.4 billion, of which 260 involved foreign nationals (5.1 per cent), worth $351 million (6.5 per cent)
• In the City of Vancouver, there were 1,139 transactions, totalling more than $1.6 billion. 47 of these involved foreign nationals (4.1 per cent), worth $64 million (3.9 per cent).
Home buyers remain active across Metro Vancouver
Posted on
July 6, 2016
by
Shirley Louie
Home buyers continue to compete for homes listed for sale across the Metro Vancouver housing market.
Residential property sales in the region totalled 4,400 in June 2016, an increase of 0.6 per cent from the 4,375 sales recorded in June 2015 and a decrease of 7.7 per cent compared to May 2016 when 4,769 homes sold.
Last month’s sales were 28.1 per cent above the 10-year sales average for the month and rank as the highest selling June on record.
"While we're starting to see more properties coming onto the market in recent months, the imbalance between supply and demand continues to influence market conditions," Dan Morrison REBGV president said.
New listings for detached, attached and apartment properties in Metro Vancouver totalled 5,875 in June 2016. This represents an increase of 1.2 per cent compared to the 5,803 units listed in June 2015 and a 6.6 per cent decrease compared to May 2016 when 6,289 properties were listed.
“Since March, we’ve seen more homes listed for sale in our market than in any other four-month period this decade,” Morrison said.
The total number of properties currently listed for sale on the MLS® system in Metro Vancouver is 7,812, a 35.9 per cent decline compared to June 2015 (12,181) and a 1.1 per cent increase compared to May 2016 (7,726).
The sales-to-active listings ratio for June 2016 is 56.3 per cent. While clearly indicative of a seller’s market, this is the lowest this measure has been since February.
Generally, analysts say that downward pressure on home prices occurs when the ratio dips below the 12 per cent mark, while home prices often experience upward pressure when it reaches the 20 to 22 per cent range in a particular community for a sustained period of time.
The MLS® Home Price Index composite benchmark price for all residential properties in Metro Vancouver is currently $917,800. This represents a 32.1 per cent increase compared to June 2015.
Sales of detached properties in June 2016 reached 1,562, a decrease of 18.6 per cent from the 1,920 detached sales recorded in June 2015. The benchmark price for detached properties increased 38.7 per cent from June 2015 to $1,561,500.
Sales of apartment properties reached 2,108 in June 2016, an increase of 18.8 per cent compared to the 1,774 sales in June 2015.The benchmark price of an apartment property increased 25.3 per cent from June 2015 to $501,100.
Attached property sales in June 2016 totalled 730, an increase of 7.2 per cent compared to the 681 sales in June 2015. The benchmark price of an attached unit increased 28.1 per cent from June 2015 to $656,900.
Demand remains elevated across the Metro Vancouver housing market
Posted on
June 30, 2016
by
Shirley Louie
VANCOUVER, BC – June 2, 2016 – Metro Vancouver* homes continue to sell at an unprecedented rate in communities across the region.
Residential property sales on the region's Multiple Listing Service® (MLS®) totalled 4,769 in May 2016, an increase of 17.6 percent from the 4,056 sales recorded in May 2015 and a decrease of 0.3 percent compared to April 2016 when 4,781 homes sold.
Last month’s sales were 35.3 percent above the 10-year sales average for the month and rank as the highest sales total on record for May.
"Home sellers are becoming more active in recent months, although that activity is being outpaced by home buyer demand today," Dan Morrison, REBGV president said.
New listings for detached, attached and apartment properties in Metro Vancouver totalled 6,289 in May 2016. This represents an increase of 11.5 percent compared to the 5,641 units listed in May 2015 and a 2.6 percent increase compared to April 2016 when 6,127 properties were listed.
The total number of properties currently listed for sale on the MLS® system in Metro Vancouver is 7,726, a 37.3 percent decline compared to May 2015 (12,336) and a 2.3 percent increase compared to April 2016 (7,550).
"Economic and job growth in Metro Vancouver is out performing most regions in the country. This is helping to underpin today’s activity," Morrison said.
The sales-to-active listings ratio for May 2016 is 61.7 percent. This is indicative of a seller’s market.
Generally, analysts say that downward pressure on home prices occurs when the ratio dips below the 12 percent mark, while home prices often experience upward pressure when it reaches the 20 to 22 percent range in a particular community for a sustained period of time.
The MLS® Home Price Index composite benchmark price for all residential properties in Metro Vancouver is currently $889,100. This represents a 29.7 percent increase compared to May 2015.
Sales of detached properties in May 2016 reached 1,865, an increase of 8.2 percent from the 1,723 detached sales recorded in May 2015. The benchmark price for detached properties increased 36.9 percent from May 2015 to $1,513,800.
Sales of apartment properties reached 2,150 in May 2016, an increase of 34.4 percent compared to the 1,600 sales in May 2015. The benchmark price of an apartment property increased 22.3 percent from May 2015 to $485,000.
Attached property sales in May 2016 totalled 754, an increase of 2.9 percent compared to the 733 sales in May 2015. The benchmark price of an attached unit increased 24.9 percent from May 2015 to $632,400.
TESTIMONIAL
“I had been shopping on my own for a new home for a long while. I don’t usually keep realtors business cards but I kept Shirley’s because I felt she was very professional and seemed to have a good idea what I was looking for. I asked her to keep an eye out for me and, much to my surprise and delight, she found a great property in a very short time.
I’m certainly glad I made the decision to contact Shirley.” ~ B. SINGH
SUTTON GROUP - VANCOUVER FIRST REALTY
205-2607 East 49th Avenue, Vancouver BC V5S 1J9
© 2018 SHIRLEY LOUIE
 The data relating to real estate on this website comes in part from the MLS® Reciprocity program of either the Greater Vancouver REALTORS® (GVR), the Fraser Valley Real Estate Board (FVREB) or the Chilliwack and District Real Estate Board (CADREB). Real estate listings held by participating real estate firms are marked with the MLS® logo and detailed information about the listing includes the name of the listing agent. This representation is based in whole or part on data generated by either the GVR, the FVREB or the CADREB which assumes no responsibility for its accuracy. The materials contained on this page may not be reproduced without the express written consent of either the GVR, the FVREB or the CADREB.